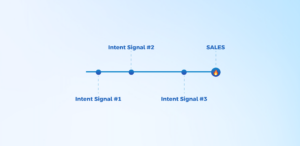
Tracking and analyzing user data to find hot opportunities forms the foundations of product-qualified leads.
But, figuring out what must be tracked in this sea of data is hard. If you’re wondering, ‘What are PQL metrics? Which PQL metrics are the most important?’, you’re in the right place.
This guide will share important product-qualified lead metrics, their role in business growth, some necessary tools, and more!
You don’t have much time to read? Take it!
TL;DR
- Product Usage Frequency can be calculated by tracking if your product is being used daily, weekly, or monthly.
- Feature Usage formula is Feature MAUs (monthly active users) / Total logins in the month * 100.
- Time Spent on the Product formula is the Total time spent during a period / Total sessions in that period.
- Onboarding Completion Rate formula is Users who finish onboarding / Users who started onboarding * 100.
- Time To Value (TTV) can be calculated by The date of realizing value – The date of customer onboarding.
- PQL to Paid Conversion Rate formula is PQLs who paid for the product / New PQL signups in the period * 100.
- Account-level Usage (especially important in B2B) can be determined by an Activity Score, which is calculated based on various weighted activities. A higher Activity Score typically indicates a higher likelihood of conversion.
Product Qualified Leads
PQLs take a new approach to user acquisition. Traditionally, a salesperson guided a prospect until they converted.
However, PQLs instead follow a self-serve model. These leads try the product and then decide on their own. They make the process simpler, faster, and more user-satisfaction-oriented.
Check this blog out to learn more about the difference between traditional leads and PQLs.
Another similar concept is product-qualified accounts (PQAs). In B2B, you sell to accounts, not users. Thus, it’s important to track account-level metrics instead of just individual user data.
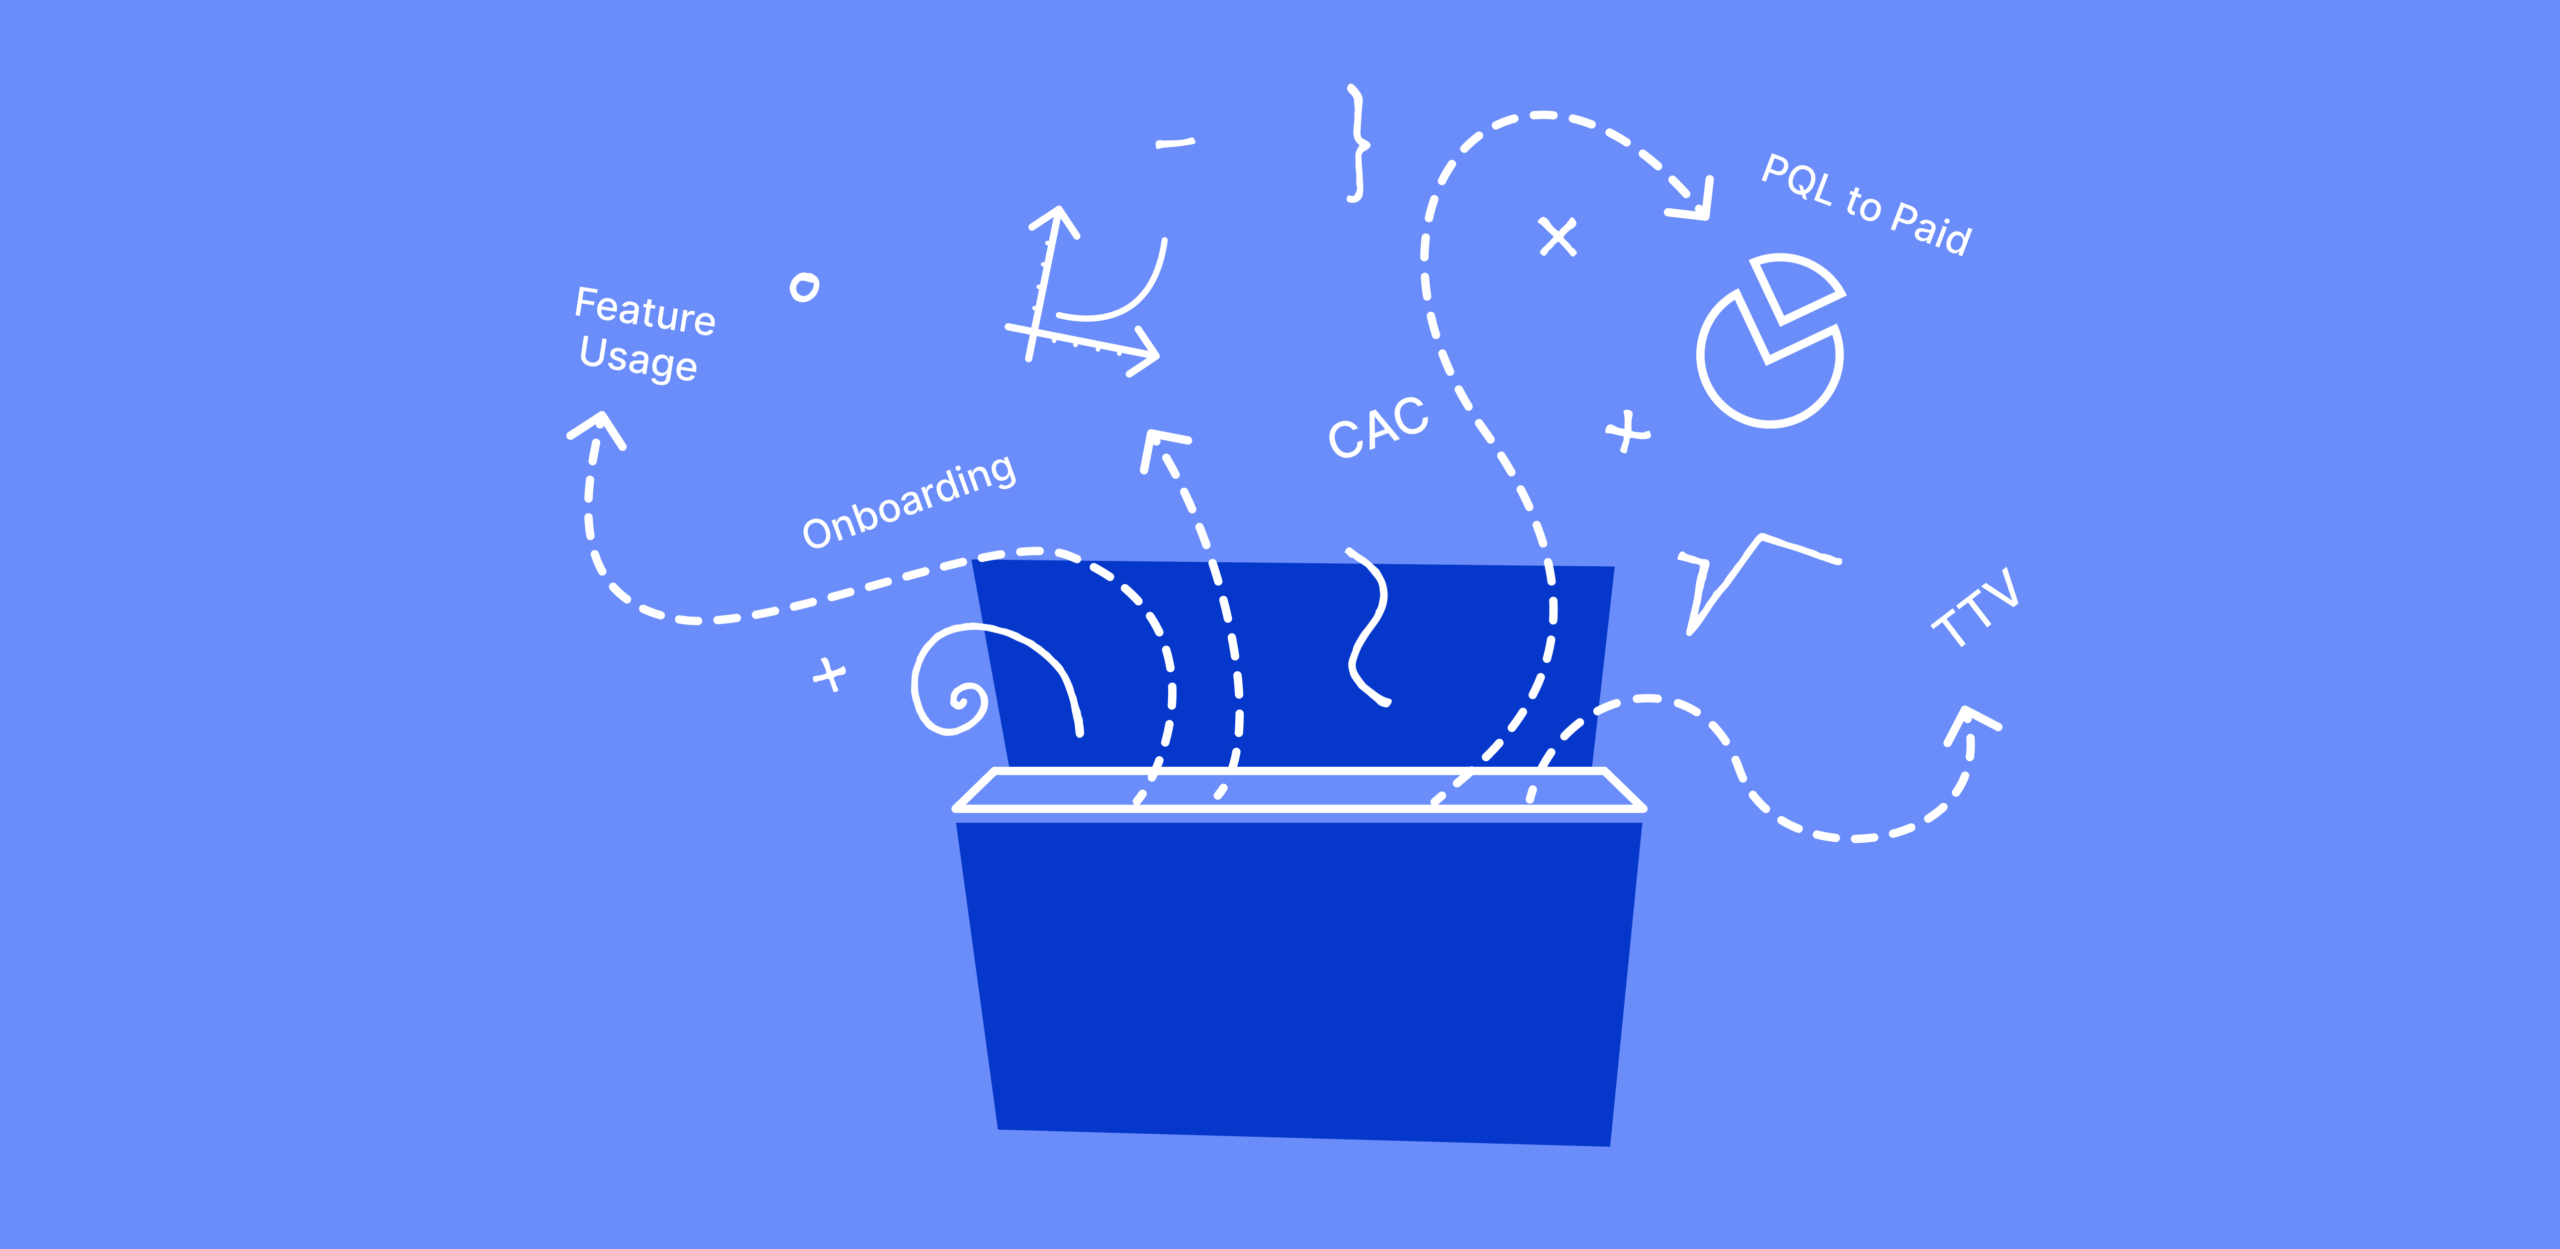
Product-Qualified Lead Metrics
PQLs are very different compared to SQLs and MQLs; thus, you can’t make the mistake of tracking the same metrics as traditional leads for them.
Also, product usage is one of the key things to measure when dealing with PQLs. It’s the most critical component for identifying PQLs, as it helps you identify their engagement and whether they’ve reached activation.
With that in mind, here are some product-qualified lead metrics you must track:
Product usage frequency
Product usage frequency will help you understand whether your product is just a vitamin or a painkiller for your target customer.
It can also help you understand where your product fits in your customer’s life. Do they use it daily, weekly, or monthly?
Feature usage

It helps you understand which features are most used by specific sets of customers.
Feature usage is beneficial while designing personalized onboarding processes for different user personas.
To calculate it, divide the MAUs of the feature by all the logins in a month, and multiply by a hundred.
Feature usage: Feature MAUs (monthly active users)/Total logins in the time * 100
Time spent on the product
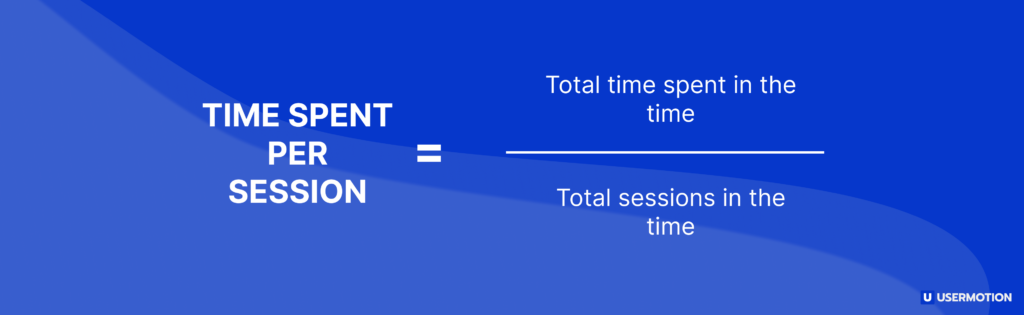
Time spent on the product is an excellent way to measure engagement and recognize if your product helps the user achieve what they’re trying to do.
For example, for an office tool like Google Sheets/Docs, the longer time spent per session, the better. It shows the user loves the product!
However, for something like Uber, the shorter the time spent, the better. It means that the user could use it easily.
This metric is essential, but it doesn’t offer much meaningful data without context and supporting metrics.
Time spent per session = Total time spent in the time/Total sessions in the time
Onboarding Completion Rate
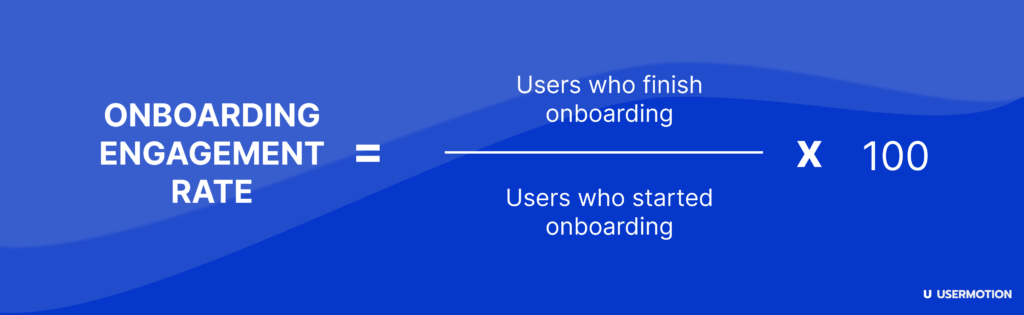
The metric measures how many users who start the onboarding complete it and is really an important metric among all product-qualified lead metrics.
Your onboarding process should guide the user to activation. Improving the onboarding engagement rate will impact your PQL rate (trial-to-PQL conversion).
Onboarding Engagement Rate = Users who finish onboarding/Users who started onboarding * 100
Time To Value (TTV)

TTV measures the time it takes for the user to realize the value of your offering.
The lower the TTV, the more PQLs you’ll signup in that time frame, and it can also help with retaining them. After all, nobody wants to spend ages before figuring out how the product can help them.
What counts as the ‘activation’ point depends from company to company. You must conduct user interviews to learn more about their pains, fears, problems, and what counts as ‘value’ for your users.
You must conduct this from the user’s perspective, not your idea of what they need.
TTV also has various subtypes that can help you better identify users in different stages of the customer journey:
- Time to basic value: This is when the user sees the minimum value of your product. It acts like a teaser and excites them for what’s to come. For example, a freemium product might offer some limited features, enticing the user to sign up for the paid trial.
- Time to exceed value: At this stage, the product has surpassed the user’s expectations, and they found it helpful in ways they weren’t expecting. It leads to trial users paying and even expansions in some cases.
- Long time to value: Used for products where the TTV is several months or more due to custom onboarding, enterprise accounts, etc…
- Immediate time to value: It’s used for products that immediately solve a problem.
The best option for measuring TTV would be to see the time it takes for an account to go from free to paid.
PQL to Paid Conversion Rate
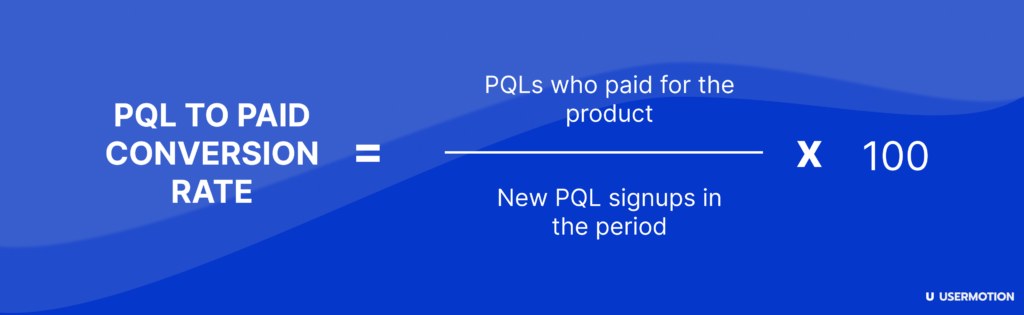
All of this leads us to the most basic yet the most important metric of all. At the end of the day, your business doesn’t exist if people will not pay for it.
A healthy PQL-to-paid conversion rate suggests that you are attracting the right users, communicating your value clearly, and offering good support, which makes them pay for your product.
It’s simple to calculate too:
PQLs who paid for the product/New PQL signups in the period * 100
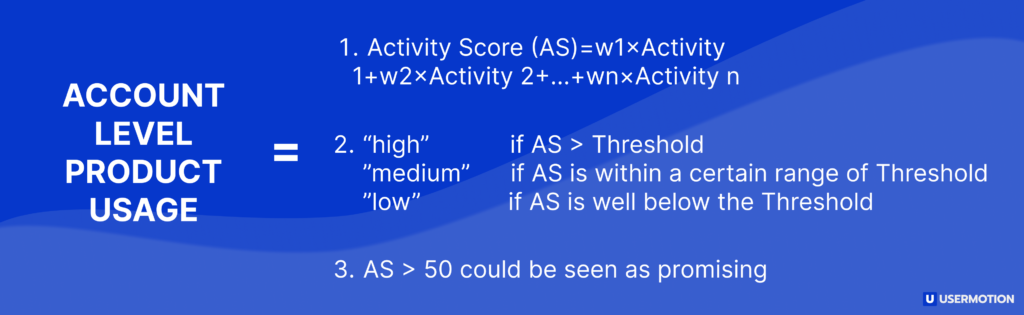
Account-level usage
B2B accounts have two kinds of people: decision-makers and advocates.
Decision makers are the C-levels who actually approve the decision to pay you money.
Advocates are the internal employees who love your product and convince their company internally to sign up for you.
You can identify and nurture these advocates by tracking account-level and individual usage to increase conversions.
Yet, there is no common or well-defined way to figure out account-level usage and get a metric or number out of it for better use. Therefore, today, I will try to light your way up with some steps and tips.
1. Collect data
Before you can make a formula, you have to gather information on all of an organization’s actions, such as the number of logins, features used, interactions, etc., and the rate at which organizations become paid users (how many of them do so).
2. Give it weight
Not every activity will affect conversion in the same way. For example, a company that uses a key feature often might be more likely to convert than a company that just logs in a lot. Give each activity a weight based on how important you think it is or how it has performed in the past.
3. Calculate the Activity Score
Activity Score (AS)=w1×Activity 1+w2×Activity 2+…+wn×Activity n
Where:
– w1,w2,…wn are weights assigned to each activity.
– \text{Activity 1, Activity 2,… Activity n} are the counts/measurements of each activity.
4. Set a cutoff point for conversion
By analyzing past data, determine an Activity Score threshold above which organizations are more likely to convert.
– For example, if organizations with an AS > 50 have historically converted 80% of the time, you can use 50 as your threshold.
5. PQA conversion likelihood formula
This formula is, of course, a simplification based on our experiences. In reality, you might want to use more sophisticated statistical or machine learning techniques to predict conversion based on multiple factors.
– “high” if AS > Threshold
– “medium” if AS is within a certain range below the Threshold
– “low” if AS is well below the Threshold
6. Define a promising rate
A “promising rate” is a subjective metric. In the example above, an 80% historical conversion for organizations with an AS > 50 could be seen as promising. However, what you consider “promising” might depend on industry standards, your company’s goals, and other factors.
7. Continuous refinement
Remember to revisit and refine your formula and threshold regularly. As you gather more data and as user behavior or your product changes, these metrics might shift.
Lastly, be cautious of relying solely on this approach. Engage with users, seek feedback, track other metrics, and incorporate qualitative insights to complement your quantitative measures.
Product-qualified lead metrics in business growth
Product-qualified lead metrics can help you exponentially improve customer acquisition and retention. They’re also very effective in driving down CAC and improving LTV. Here’s how:
Customer Acquisition and Retention
Tracking these metrics in a product-led sales company will help you qualify them based on their readiness to buy and engagement levels. The data can also help you understand their position in the lead lifecycle and better nurture them.
An essential part of customer acquisition is messaging. PQL tracking will help you segment users based on their engagement, and then you can personalize your messaging accordingly.
Apart from that, these metrics will also guide you in product development. You can figure out potential UI/UX issues and the user’s feature needs, which will aid retention.
The last thing you want is for an existing customer to churn because the product didn’t meet their expectations.
Impact on sales efficiency
44% of sales reps complain about lead quality and 39% about buying readiness. Correct metric tracking and qualification will ensure your sales reps aren’t one of them.
Going after the right leads will also ensure you close more with less effort. You can build PQL profiles that’ll help you prioritize leads with a high readiness to buy.
Analyzing the huge data available can also help you iterate your sales funnel with a data-driven approach.
These steps will improve your existing sales efficiency and help you set up a product-led sales motion if you don’t already have one.
How to track and analyze product-qualified lead metrics?
Understanding the behavior of PQLs (Product-Qualified Leads) is essential for businesses looking to scale. Utilizing the right software tools can provide profound insights into their actions, preferences, and potential for conversion. Let’s dive deeper into how to use these tools effectively:
Sales intelligence platforms like UserMotion. Why?
- Sales intelligence platforms that employ predictive lead scoring helps in ranking leads based on their likelihood to convert into paying customers.
- The integration capability of these platforms lets you collect all your customer data together from A to Z.
- These platforms analyze the behavior patterns, historical data, and other factors to segment and score each lead.
- And their predictive lead scoring system lets you review and tailor your sales and growth strategies regularly by generating reports and historical data.
Product analytics platforms like Mixpanel and Amplitude track and analyze user activity. Why?
- These tools help you create dashboards that visualize user activity trends.
- These tools segment users based on several different factors.
- And their segmenting system helps guide your sales and growth.
CRMs like HubSpot and Salesforce to track the lead’s status. Why?
- These tools integrate your CRM with other tools in your tech stack.
- These management platforms record every interaction with a lead.
- CRMs let you set reminders for follow-ups, and monitor the lead’s progress.
Customer feedback tools like Refiner and SurveyMonkey. Why?
- Surveys help you understand customer pain points, needs, or satisfaction levels.
- These platforms offer embedded surveys directly into your product.
- Analyze survey results in SurveyMonkey, segmenting responses to identify trends among PQLs.
Onboarding software like Appcues and Userpilot. Why?
- These solutions offer guided product tours or onboarding flows for new users.
- They help you analyze drop-off rates during the onboarding process. A well-engaged user during onboarding can often indicate a high-quality lead.
- And finally, you can update your onboarding content based on user feedback and behavior trends.
Conclusion
Product-led growth and PQLs are built on data. Robust metrics tracking is integral for your company’s growth.
We covered how PQLs differ from typical leads, what metrics to track, why they’re so important, and some essential tools.
Thanks for reading!
Frequently Asked Questions
What are product qualified leads metrics?
Essential PQL metrics include Product Usage Frequency, which gauges how often users interact with a product, and Feature Usage, calculated by dividing feature monthly active users by total logins for the month. Time Spent on the Product measures user engagement, while Onboarding Completion Rate reflects the efficiency of the onboarding process. Time To Value (TTV) indicates the duration for users to perceive the product’s value. PQL to Paid Conversion Rate offers insights into how many PQLs become paying customers, and Account-level Usage provides a detailed view of user activity within B2B organizations, helping identify account-level buying intent.
What is the measure of a PQL?
You can classify someone as a PQL if they’ve used your product, derived value from it, fit your target audience, and show buying intent. It’s often used for companies offering a free trial or plan but also applies to customer expansions and renewals.
How do you identify a product-qualified lead?
Here are the steps for identifying PQLs:
- Create an activation journey/onboarding process that helps the user discover key features of your product.
- Track product usage data to see which users get the most value and show buying intent.
- Use the lead scoring system to rank the leads based on firmographic data, product data, and buying intent.
The leads with the highest score are the ones to go after, while you can nurture the rest.