Growing a business involves a strategy of both acquiring new customers and preventing existing ones from churning.
So, just as much as we invest in acquiring the right leads and converting them, we need to invest the same, or sometimes even more, in retaining our existing customers.
In this article, we will evaluate what churn prediction is, why it is important, how to do it right with the key signals, tools and examples.
TL;DR
- Churn prediction is simply identifying signals that a customer is at high risk of churn or abandoning your product.
- Churn prediction helps you to take action beforehand to prevent customer cancellations through different strategies, campaigns and engagements.
- A churn prediction model works by analyzing key signals you’ve setup and previous/historical customer churn data, and predict the churn likelihood with AI algorithms.
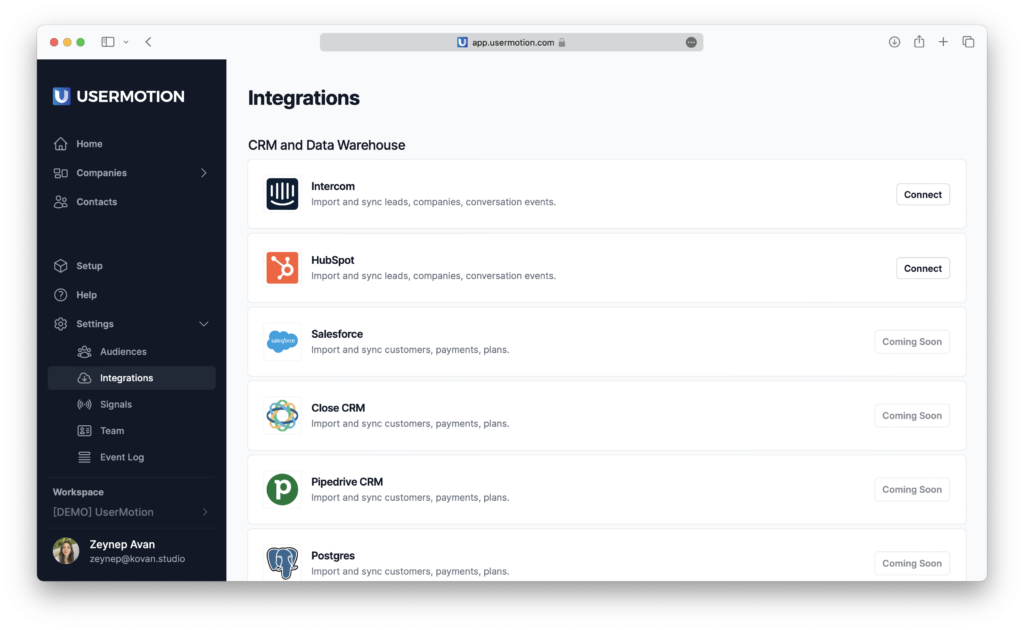
- You need all data in hand to start this process, including customer information, product usage, customer success data, and payment data.
- As a second step, you identify key signals of each of those data groups, because it become more accurate and clear with all these together.
- Finally, you make either manual data analysis, or predictive data analysis that uses machine learning to refine your model with historical data.
- UserMotion’s predictive data analysis helps you identify churn signals and prevent it by sending you signals in real-time.
What is Churn Prediction?
Churn prediction is simply identifying the signals of churn before it really happens. It uses indicators of a high risk of a customer cancelling their subscription or abandoning your product, allowing you to take action beforehand.
Predicting churn requires the identification of key signals, using historical churn insights, and utilizing AI-driven predictive models. These elements work together to indicate when a customer is likely to churn, enabling your company to proactively take action.
What is a Churn Prediction Model?
Key signals + historical churn data + AI algorithms = churn prediction
A churn prediction model is a predictive analytics that uses AI algorithms to forecast if a customer is on the edge of leaving your service or stopping the use of your product.
Essentially, this model works by analyzing key signals you’ve setup and previous customer churn data. It makes predictions based on these signals and historical data together, ultimately scoring the likelihood of churn.
To make this model work properly, you should make it possible to examine all the customer dataset. This includes multiple datapoints that describe your customers and their behaviors – demographic data, historical data, product usage, usage patterns, subscription information, etc.
It should also include a score or indicator that shows you the likelihood of churn and why. This means it needs a clear view of showing you “X user is at the risk of churn, because of Y and Z.“
Why is Predicting Churn Important?
You can acquire a new customer but it takes time, effort and money to create real relationships, built trust over time and turn it into a customer with high LTV. A real issue for subscription model businesses.
However, consider this scenario. You have a high-value customer who has been using your product for over two years, but is now deciding to leave. The cost here extends far beyond the immediate loss.
You are not just losing a customer; you are losing the trust and loyalty that took years to build. Moreover, you also lose the potential revenue and positive word-of-mouth that customer could have continued to generate.
So, it’s crucial to not only understand why customers are leaving your service but also to identify the signs of their potential churn before it happens. This predictive insight allows you to address concerns and improve the customer experience.
Implementing effective strategies for customer retention and satisfaction becomes key in maintaining a sustainable business model and minimizing the costly impact of churn. It helps your company to:
- Design and implement re-engagement campaigns specifically for customers who are at risk of churning.
- Address the unique concerns and preferences of these customers, increasing the chances of retaining them.
- Create educational content that addresses common issues and enhance customer understanding, ultimately increasing their lifetime value.
- Analyze churn trends to refine customer personas, and market segmentation strategies.
- Improve product development and improvement strategies.
- Improve the overall customer experience.
- Ensure a steady revenue stream and potentially increase it over time since acquiring new customers is more expensive than retaining existing ones.
How to Create Churn Prediction Model
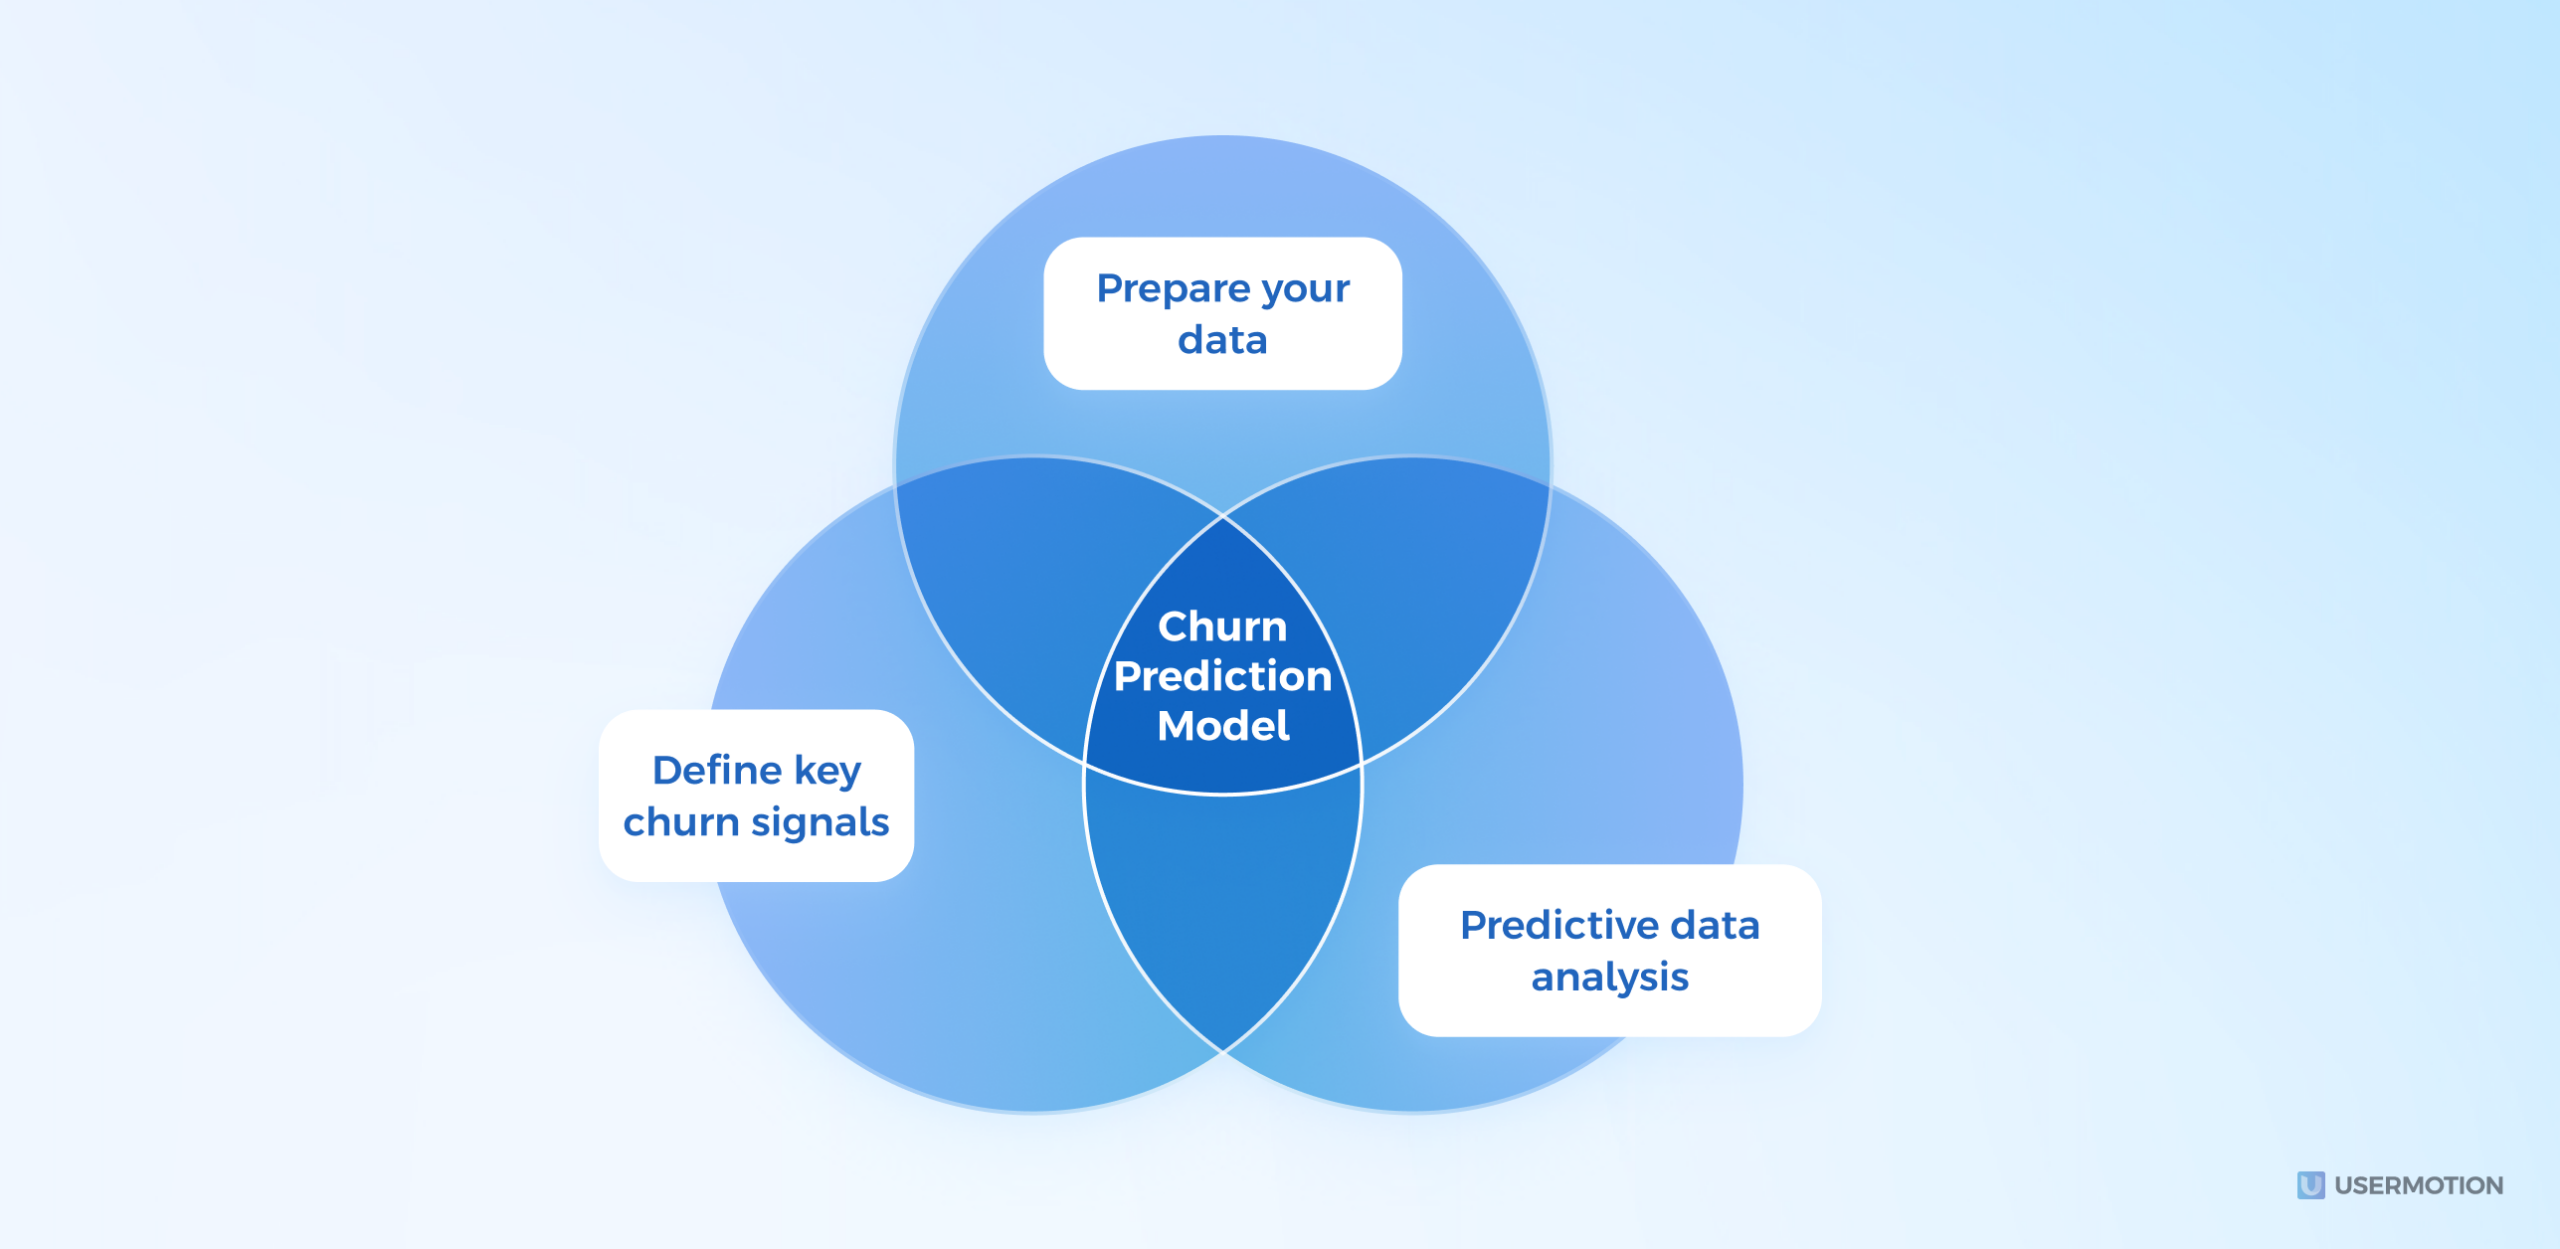
There are several main stages of creating a churn prediction model, as follows:
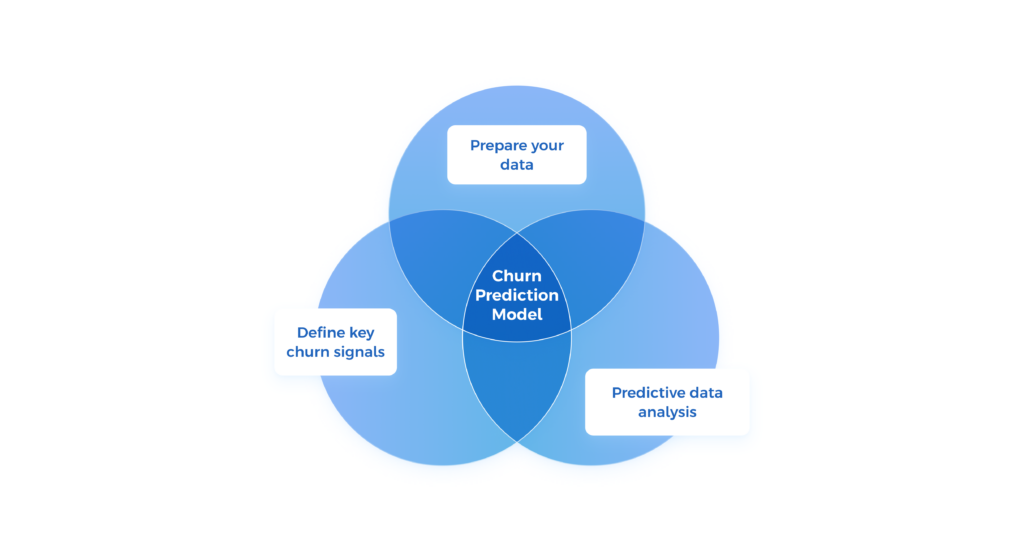
- Prepare your data: Collect all relevant data and prepare it for this model to work properly. This includes all demographic information, product usage, customer success metrics, subscription information and feedback data.
- Define key signals: Understand and define all possible churn signals/factors for your product specifically.
- Predictive data analysis: Start training your AI model with the data on your hand, so it can make better predictions and give insights in the long term.
How to Start it Working: Data Preparation
The first step in creating a churn prediction model is to prepare your data. This is the most important part because the more data you provide to the model, the better it gets to detect even a single churn possibility. The accuracy and effectiveness of your model heavily depend on the quality and comprehensiveness of the data fed into it.
Data preparation involves collecting a wide range of information, such as demographic details, product usage statistics, customer feedback, and subscription data.
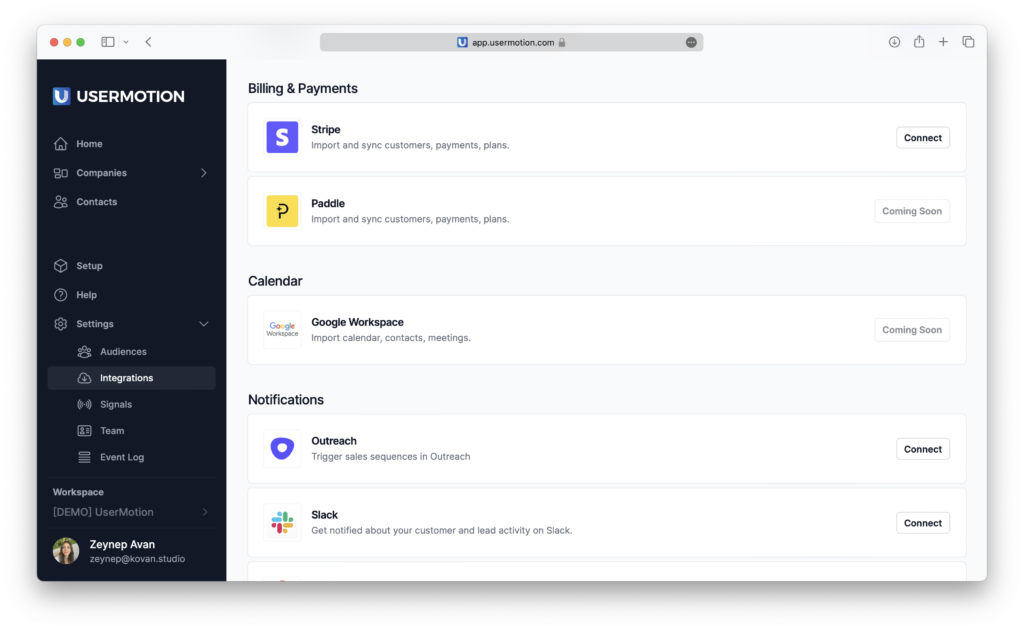
Customer information
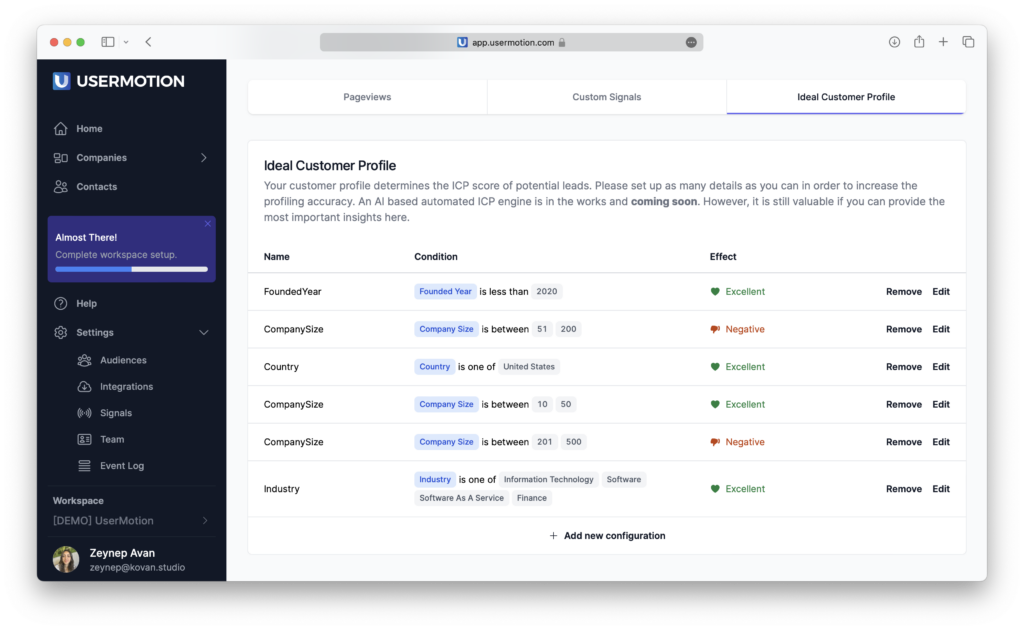
Customer data is all information a customer has, to identify if they fit in your ideal customer profile. It includes:
- Demographic characteristics: Tells you about industry/specialization, type of business, location/geography/target market, company age, company size and tech stack.
- Unique characteristics: Tells you about revenue, company work style, investment, pain point/challenge, goal, budget, and where user spends time.
- User persona: Tells you about who is the user and what are their characteristics.
- Buyer persona: Tells you about who is the buyer and what are their characteristics.
Product usage data
Product usage data is how customers use your product. It includes:
- Feature usage data: Tells you which and how features and parts of your product are used by your customers.
- Customer behavior: Shows how often users log in, to how long they stay, and what they do on your product, giving a full picture of their usage flow.
- Clicks: Counts how many times users interact with different parts of your product, like clicking pages, buttons or menus.
- Others: Includes other metrics and data like how quickly users see value from your product and how often they come back, helping understand overall engagement.
Customer success data
Customer success data is crucial for understanding how satisfied and successful users feel with your product. It helps in identifying:
- Net promoter score (NPS): Measures customer loyalty and their likelihood to recommend your product to others, giving insights into the overall perception of your brand.
- Customer satisfaction (CSAT): Shows the percentage of customers who are satisfied with your product, providing a direct measure of customer happiness.
- Customer feedback: Collects users’ opinions and suggestions, offering valuable insights into what customers like or want improved.
- Support ticket trends: Analyzes the volume and nature of customer support requests, indicating areas where users may be experiencing challenges.
Payment data
Understanding payment data is essential for analyzing customer commitment and financial health. It includes:
- Transaction history: Tracks all payments made by the customer, offering insights into their purchasing patterns and loyalty to your product.
- Payment methods: Identifies the types of payment methods used, which can indicate customer preferences and potentially their trust level in your platform.
- Payment failures: Monitors failed transactions, which can signal financial issues or dissatisfaction, possibly leading to churn.
- Subscription changes: Observes any upgrades, downgrades, or cancellations in subscriptions, directly reflecting customer satisfaction and perceived value.
This stage is not just about gathering data but also cleaning and organizing it in a way that makes it accessible and meaningful for analysis.
Properly prepared data can significantly enhance the model’s ability to identify indicators of potential churn, making this step the cornerstone of successful churn prediction.
Predict Potential Churns: Key Signals
Identifying key signals of potential churn is critical in the early detection and prevention of customer churn.
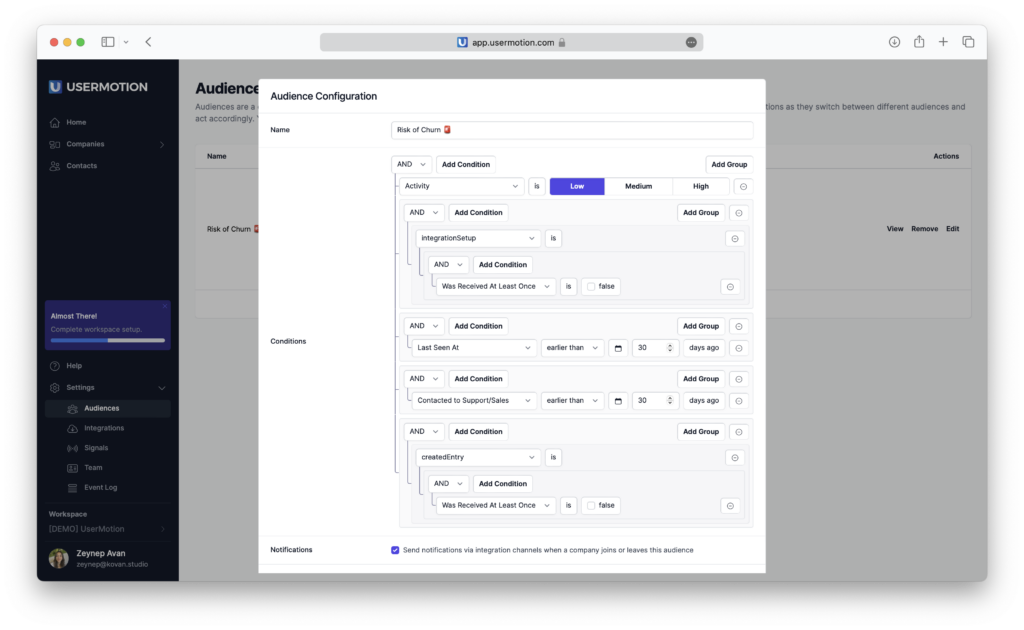
This involves analyzing customer behavior and engagement patterns to spot early warning signs that a customer might be considering leaving. It can include a decrease in product usage, negative feedback, or changes in subscription plans.
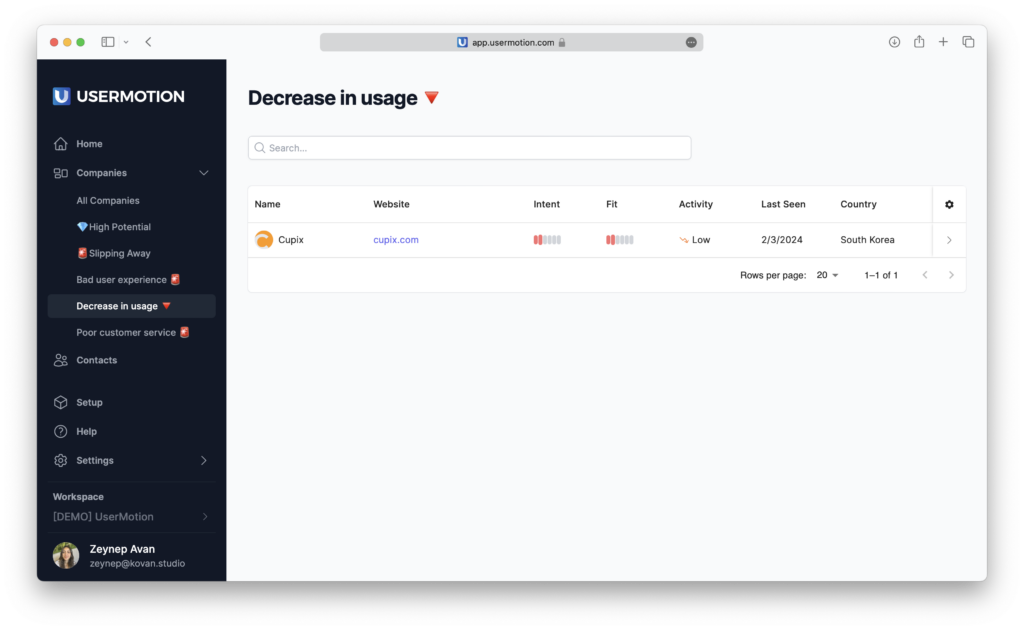
Churn signals
Churn signals can vary a lot based on the specific business and product characteristics. Some general signals include:
- Decrease in usage: A noticeable decline in usage frequency or duration signals decreasing interest or satisfaction.
- Reduced feature use: When customers stop using key features or only use basic functions, it may suggest they’re not finding the full value in your product.
- Integration uninstall: When customers remove integrations with other tools or services, it may indicate dissatisfaction or a move away from your product.
- Team member leaving the workspace: If entire teams or key users deactivate their accounts or leave the workspace, it’s a strong indicator of organizational shifts away from your product.
- Change in usage patterns: Significant changes, such as shifts from daily to sporadic use, could indicate a move towards alternative solutions.
- Negative feedback: Complaints or poor reviews highlight dissatisfaction.
- Subscription downgrades: Plan downgrades or cancellations indicate customers reassessing the product’s value.
- Lack of engagement: Falling interaction with communications points to decreasing interest.
- Payment issues: Recurring payment failures or declined transactions can signal financial dissatisfaction or intent to leave.
- Service interruptions: Frequent or unresolved service disruptions may push customers towards churn due to reliability concerns.
- Competitive switches: Customers exploring or mentioning competitors could be evaluating alternatives, hinting at potential churn.
Churn trends
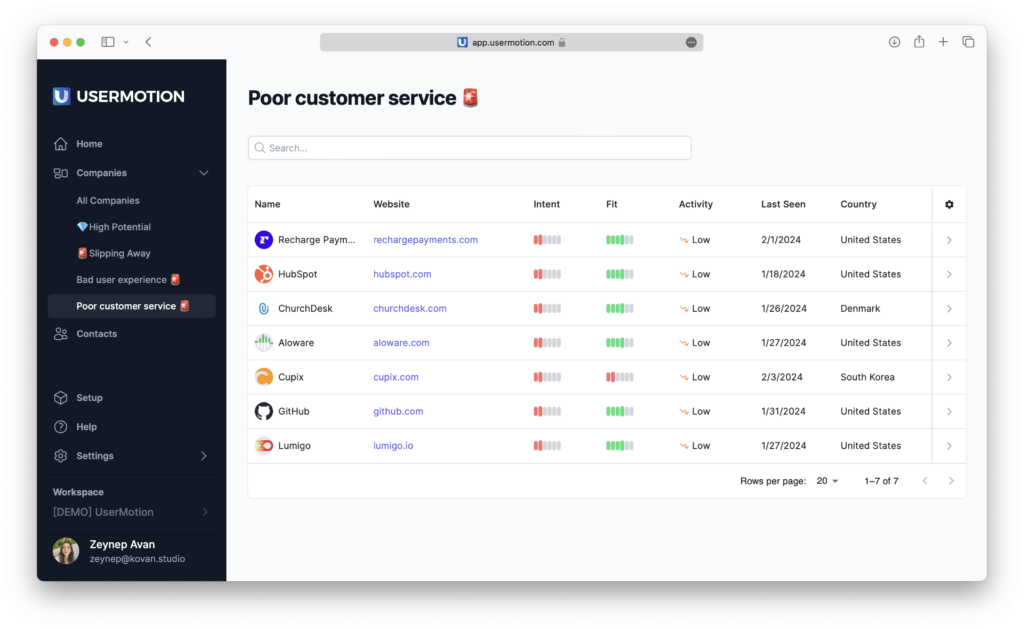
With those signals in the hand, analyzing churn trends is key to uncovering why customers decide to leave your product. This involves:
- Bad user experiences: Identifies instances where users face difficulties or frustrations, leading to dissatisfaction with your product.
- Poor customer service: Highlights how inadequate support or slow responses contribute to customer churn.
- Lack of value: Reveals situations where customers feel they are not getting enough benefit or usefulness from your product, prompting them to cancel.
- Competitive offers: Examines how offers from competitors might lure your customers away, especially if they perceive better value elsewhere.
By defining and monitoring these signals, and trends, businesses can develop more targeted strategies to retain customers.
This proactive approach not only helps in retaining valuable customers but also provides insights into areas where the product or service can be improved.
Tools for Churn Prediction: Predictive Data Analysis
The heart of churn prediction lies in predictive data analysis, where advanced tools and algorithms are used. See the difference.
Manual data analysis
This way you need to do all the steps and refinements by yourself. You need to understand each aspect of churn prediction, from data preparation to signals, or from relevant churn insights to the room for improvement.
Predictive data analysis
This is where technology takes over, doing the heavy lifting for you. By feeding historical data into machine learning models—where you already know who stayed and who left—it lets the algorithms find patterns. These patterns help predict future behavior, identifying which current users might be on their way out based on similar signals. It’s an automated and accurate way to foresee churn, giving you the chance to follow the right strategies to retain your customers.
Training an AI model with the prepared data to recognize patterns and predict which customers are most likely to churn. Here’s how it all comes together:
- Machine Learning Models: Use special AI algorithms that learn from the data. They look at patterns to figure out who might stop using our product.
- Predictive Analytics: This is like making educated guesses. Based on what happened before, we can guess who might leave us soon. This helps us act early to keep them.
- Actionable Insights: From all the guessing, we learn specific things we can do to make customers happy and want to stay. This could mean fixing something they don’t like or giving them something they value.
- Continuous Improvement: This system gets smarter as it goes. Every time we add new information, it gets better at predicting who might leave. This means we can keep getting better at keeping our customers.
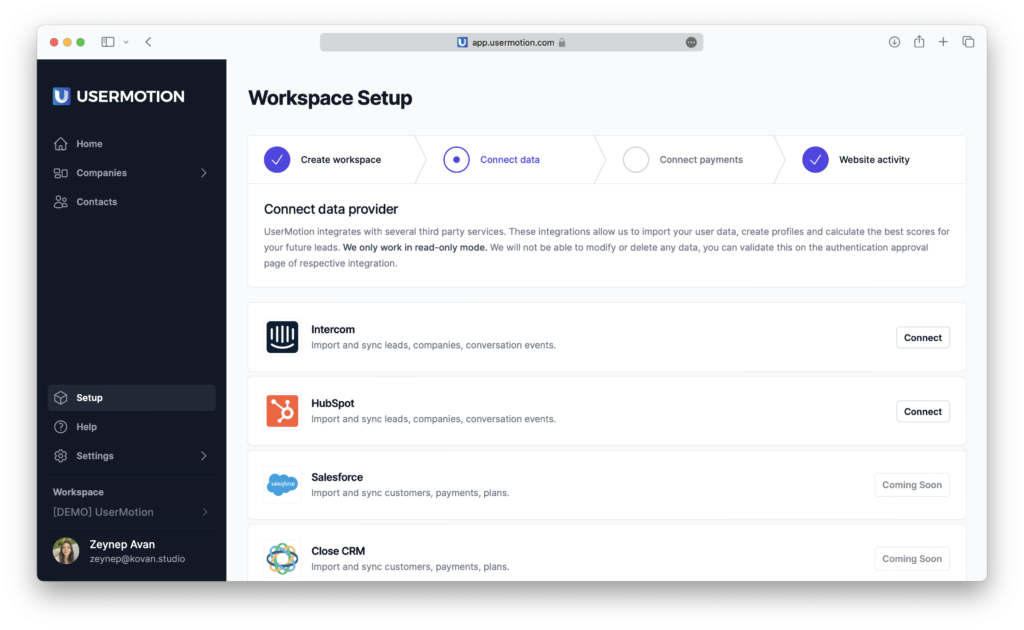
The use of machine learning algorithms enables the model to continuously learn and improve from new data, making its predictions more accurate over time.
Predictive data analysis can provide valuable insights into customer behavior, helping businesses to not only anticipate churn but also understand the underlying factors contributing to it.
Prevent churn = retention
If you have all those churn insights before it happens, the retention becomes so much easier. Still, there are few different strategies to use when preventing churn.
Feedback and surveys
Listen to what your customers say, not just when they might leave. Use surveys and sentiment analysis tools to understand their feelings from surveys, social media, or help requests.
Have a team ready to use this feedback to make your product and support better. Show your customers how their challenges can be solved, making it clear that their voices help shape your product.
Collect data as much as possible
You need lots of data. By saying lots, I don’t mean the number of metrics. You need lots of historical data to determine why previous customers have churned and determine whether there is a pattern.
- Do they churn more if they don’t use a certain feature?
- Do they churn more if they log in under a certain number of times each month?
- Are the low-touch customers more likely to churn?
- Does a number of support tickets affect their likeliness to churn?
- Has your company had a time when churn was highest/lowest? What changed since then, and at what point did you see the most drastic difference in churn numbers?
Segment your customers
Since different users with different needs and usage patterns don’t churn because of the same reason, you need to put them in separate segments.
For instance, segment them based on:
- Demographics: their location, region, company size, and year signed up to your company.
- Behavior and usage: Do they use a certain feature more/less, how often do they log in, did they complete the onboarding?
- Contract terms: What pricing plan are they on, did they sign up for a monthly/quarterly/yearly deal?
Personalized engagement campaigns
Don’t just reach out; connect with at-risk customers through campaigns created to their specific problems.
Use data analytics to understand their behavior and preferences, then create offers, content, and messages on a personal level.
This could include personalized discount codes, access to exclusive features, or personalized product recommendations. The goal is to make each customer feel seen and valued.
Get notified immediately if a churn signal appears
By combining historical data with metrics and the customer 360 tool’s algorithms, you get little baby notifications.
Those baby notifications are cute, and let you know that it is time for you to check on them.
They are cute because they help you make your business more profitable by focusing on the right customers at the right time.
Education
Ensure customers fully understand and use the breadth of your product’s capabilities by enhancing your continuous education efforts.
Develop in-depth tutorials, webinars, and user guides that showcase unrealized features or new functionalities.
Gamification can encourage engagement with different aspects of your product, offering rewards or recognition for exploring new features. This approach helps to deepen the customer’s investment in your product, making it hard to leave.
How to Do It in Short
- Gather customer information, product usage, success metrics, and payment data.
- Identify key churn signals from the collected data.
- Use predictive data analysis with AI algorithms to forecast churn likelihood.
- Regularly update and refine your model with new data for accuracy.
- Implement targeted engagement campaigns for at-risk customers.
- Conduct surveys to collect direct feedback and assess customer satisfaction.
- Segment users for personalized experiences based on their data.
- Analyze user behavior and feedback to identify and fix product or service issues.
- Utilize feature tagging to understand how different aspects of your product are used.
- Perform funnel analysis to spot and address conversion bottlenecks.
- Create educational content to improve customer product knowledge and value perception.
- Act on payment data insights to address potential financial dissatisfaction signals.
- Regularly communicate with customers about updates and improvements made based on their feedback.
- Use UserMotion or similar platforms for real-time churn signal detection and action.

