With the right information, company size, and industry data, along with insights into how leads interact with your product or website, businesses can focus their business and sales efforts. Today, I want to share a simple lead scoring template with you so you can set up your own lead scoring system as simple as possible.
Table of contents
What is Lead Scoring?
Lead scoring is a method where potential customers are assigned a score that indicates how likely they are to make a purchase or start a subscription. This system enables businesses to prioritize their efforts on leads most likely to convert into customers, making their sales and marketing strategies more efficient.
The scoring process heavily relies on explicit data, which includes specific information provided by the customer. This can be their company information, job role, or the industry they’re in. For businesses operating in a B2B context, such data highly focuses on company demographics, helping to assess the potential value of each lead more accurately.
Beyond explicit data, lead scoring also includes insights from product usage and engagement data. This approach looks at how leads interact with your product or website, such as the frequency of their visits and the features they use. Analyzing these behaviors provides a deeper understanding of a lead’s level of interest and potential purchase readiness, making this combined analysis a powerful tool in lead scoring.
Why Lead Scoring is Important?
Without lead scoring, sales teams can end up chasing leads randomly, wasting time on people who might never buy anything.
By using lead scoring, businesses can:
- Quickly spot the hottest leads, which means they can identify who is more likely to become a customer.
- Use certain criteria to sort leads, helping pinpoint those with a high chance of buying.
- Make the sales team’s job easier by highlighting which leads to focus on first, thanks to integrating lead scoring with their customer relationship management (CRM) system.
- Better understand a lead’s potential by looking at the activities, company size, job title, and more.
This method isn’t just about selling more; it’s about selling smarter. It helps teams work together better and tailors their approach to fit the perfect customer.
3 Different Lead Scoring Systems
– 100-point system
– Hot vs. cold system
– Co-dynamic system
– Fit system
– Activity system
Several lead scoring models are available, each offering unique advantages and disadvantages.
100-Point System
In this model, leads receive a score from 1 to 100, with higher scores indicating better potential. This method evaluates leads based on their demographic and firmographic fit, as well as their level of activity.
- Advantages: Simple to implement and operate.
- Disadvantages: Lacks consideration for timing, potentially overlooking leads at their most interested.
Hot vs. Cold System
Scores in this model are depicted through visual indicators like hot peppers or flames, where more indicators signify a more promising lead. It assesses leads solely on behavior and activity, excluding fit criteria.
- Advantages: Straightforward to set up with a binary hot or cold classification.
- Disadvantages: Fails to account for fit, missing crucial intent signals by neglecting half of the relevant data.
Co-Dynamic System
This approach assigns a score combining a letter (A to D, indicating fit from highest to lowest) and a number (1 to 4, indicating engagement from highest to lowest), resulting in 16 distinct score combinations.
- Advantages: Offers a comprehensive evaluation by considering all available data, facilitating detailed segmentation for targeted content strategies.
- Disadvantages: More complex to implement without automated tools, requiring more effort to manage effectively.
The Fit System
This model evaluates leads based on how well they align with your ideal demographic profile, using easily accessible quantitative data. Such data often includes job title, company size, annual revenue, employee count, and industry sector, which can be collected from lead forms on your website. The simplicity of tracking these demographics makes the Fit Model particularly user-friendly.
- Advantages: Utilizes readily available data, simplifying the tracking process. By focusing on demographics that mirror those of top customers, it aligns marketing efforts with the most promising prospects.
- Disadvantages: May overlook leads with high engagement but different demographic profiles. Determining the most impactful demographics requires analysis and may necessitate adjustments over time.
The Activity System
This model scores leads based on their interactions with your business, such as website visits, content downloads, form submissions, and email engagement. Although tracking these activities can be more complex than demographic data, incorporating them is essential for a comprehensive understanding of lead interest and intent.
- Advantages: Offers insight into a lead’s engagement level and interest, providing a dynamic component to lead scoring. Can be automated with most CRM systems to track basic interactions like email engagement.
- Disadvantages: More challenging to implement due to the need for integrating various data sources and actions. Manual input or third-party tools may be required to track certain activities, adding complexity.
Simple Lead Scoring Template
The easiest way to create a lead scoring system on your own is to use 100-point system. This system helps prioritize leads based on how likely they are to convert into customers.
To make it even easier, duplicate and use the customizable lead scoring template we have created for you.

Here’s a step-by-step approach to build your lead scoring model:
1. Identify Explicit and Behavioral Data
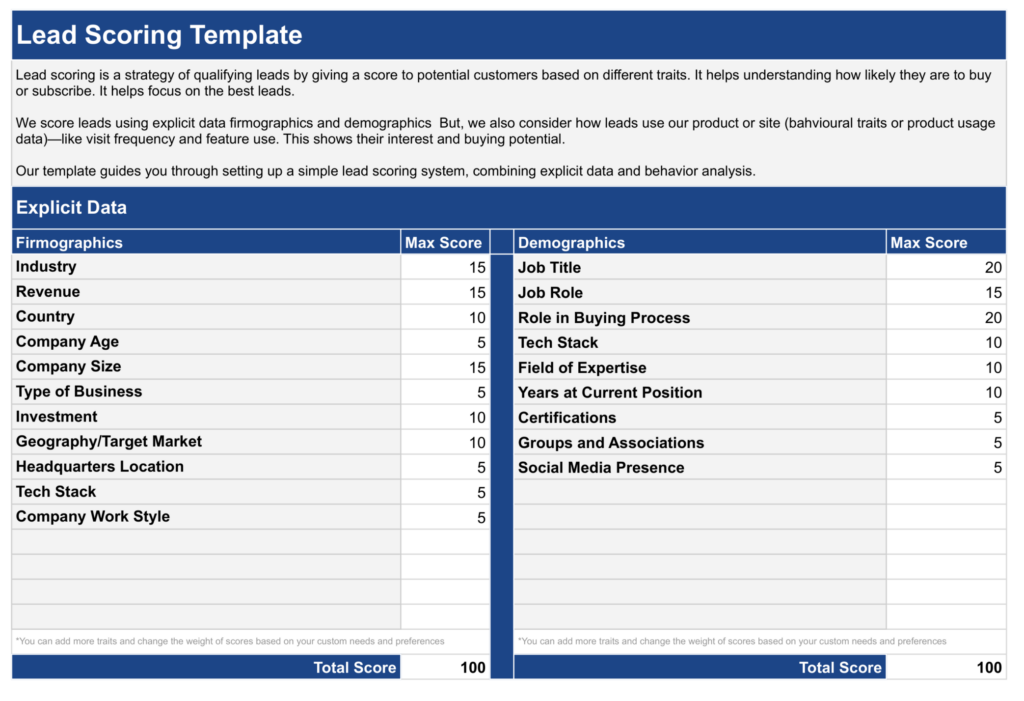
First, you need to list all the explicit data, including firmographics and demographics. It provides clear insights into a lead’s background, including their industry, company size, and role.
This information helps prioritize leads by matching them with your product’s or service’s ideal customer profile. It forms the basis for targeted marketing efforts, ensuring resources are focused on the most promising prospects.
Firmographics data can include:
- Industry
- Revenue
- Country
- Company Age
- Company Size
- Type of Business
- Investment
- Geography/Target Market
- Headquarters Location
- Tech Stack
- Company Work Style
Demographics data can include:
- Job Title
- Job Role
- Role in Buying Process
- Tech Stack
- Field of Expertise
- Years at Current Position
- Certifications
- Groups and Associations
- Social Media Presence
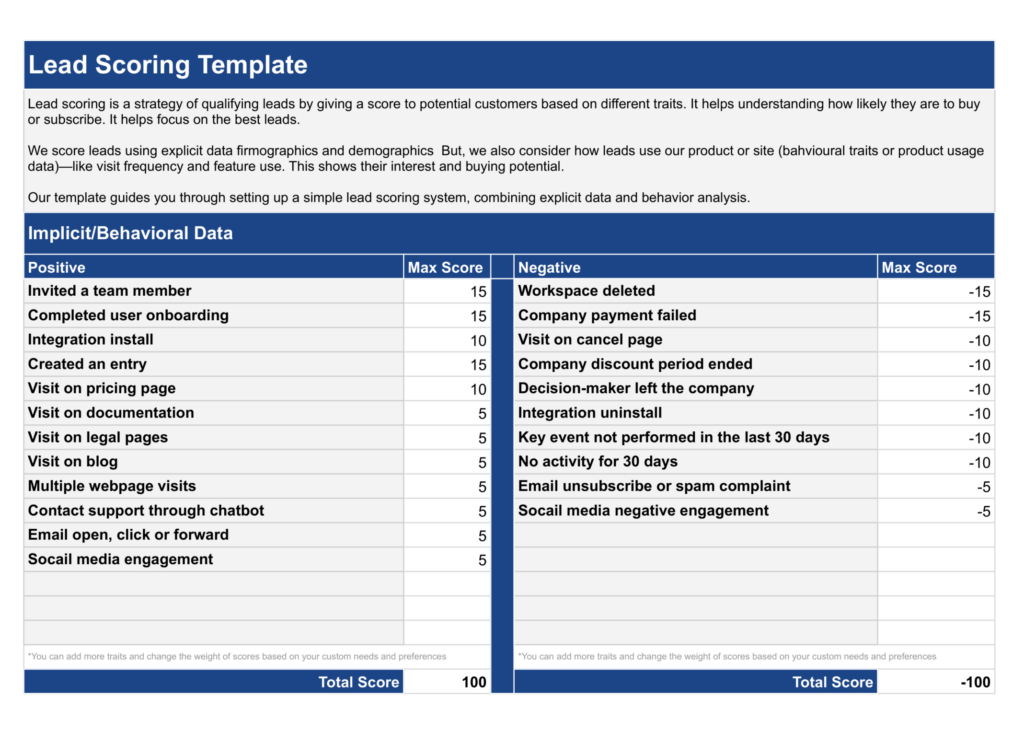
After listing all explicit data (firmographics and demographics), you’ll also need to identify implicit or behavioral criteria.
Implicit data includes online behavior, engagement with your website and app, social media interaction, and email responsiveness. These criteria can signal a lead’s interest level and readiness to purchase, with both positive and negative signals.
Positive signals can include:
- Invited a team member
- Completed user onboarding
- Visit on demo
- Integration install
- Created an entry
- Visit on pricing page
- Visit on documentation
- Visit on legal pages
- Visit on blog
- Multiple webpage visits
- Contact support through chatbot
- Requested pricing/contact sales
- Email open, click or forward
- Socail media engagement
Negative signals can include:
- Workspace deleted
- Company payment failed
- Visit on cancel page
- Company discount period ended
- Decision-maker left the company
- Integration uninstall
- Key event not performed in the last 30 days
- No activity for 30 days
- Email unsubscribe or spam complaint
- Social media negative engagement
2. Assign Points to Each Criteria
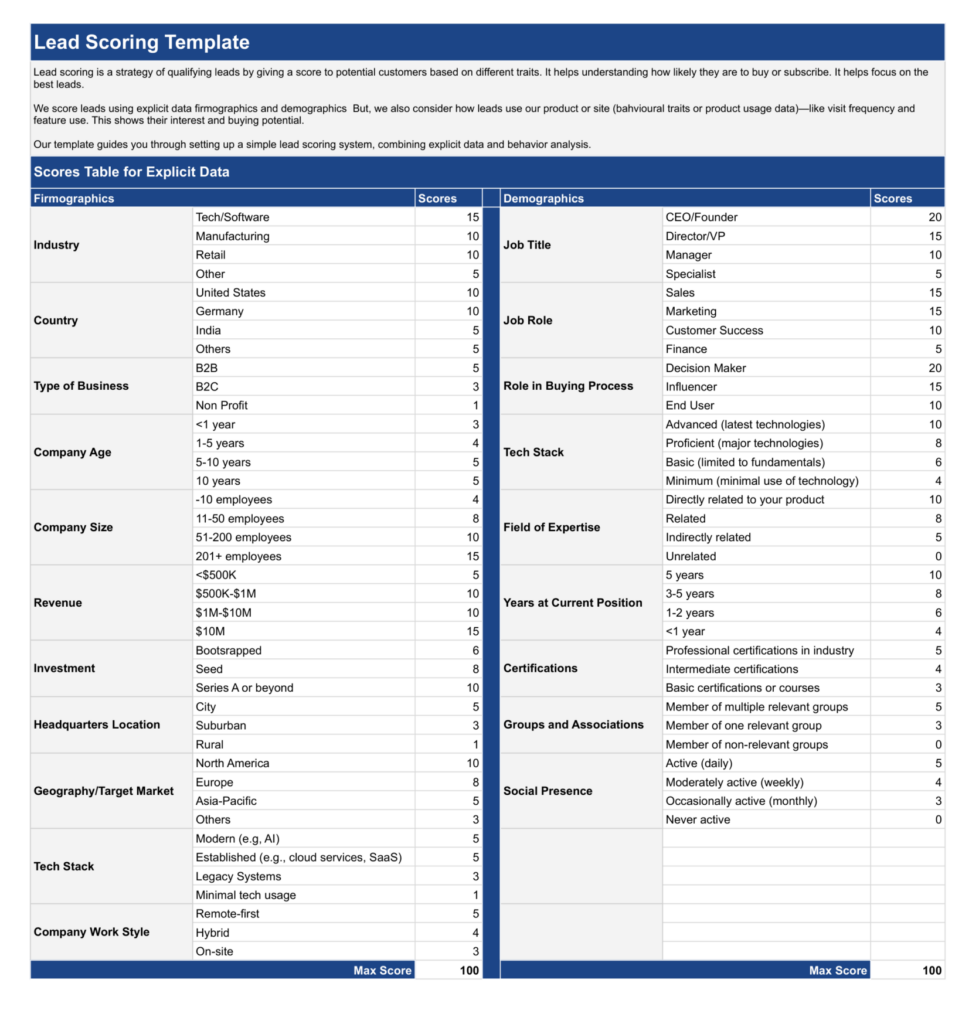
Assign a point value to each criterion based on its significance towards indicating a lead’s likelihood to convert. High-value actions or traits should be given more points.
For example:
- Explicit Criteria: Job title (CEO: 20 points, Manager: 10 points), Company size (200+ employees: 15 points, -100 employees: 5 points)
- Implicit/Behavioral Criteria: Created entry (1-5: 10 points, +5: 15 points), Email opens (Opened 5+ emails: 15 points, Opened 1-4 emails: 5 points)
3. Create Scoring Thresholds

Define thresholds to categorize leads into different levels of sales readiness, such as hot, warm, or cold. For instance, you might consider leads with a score of 70+ as hot, 40-69 as warm, and below 40 as cold. These thresholds help your sales team prioritize their efforts.
4. Implement and Integrate
Implement your scoring system in your Customer Relationship Management (CRM) tool or marketing automation platform. Ensure that the scoring updates dynamically as leads interact with your brand.
5. Monitor
Regularly review the performance of your lead scoring model. Analyze conversion rates and feedback from the sales team to adjust point assignments and thresholds. This process ensures your scoring remains relevant and aligned with your sales goals.
6. Example and Template
| Firmographics | Criteria | Max Score | Score | Demographics | Criteria | Max Score | Score | Positive Behavioral Data | Criteria | Score | Negative Behavioral Data | Criteria | Score |
|---|---|---|---|---|---|---|---|---|---|---|---|---|---|
| Industry | Software and Technology | 15 | 15 | Job Title | Manager | 20 | 10 | Invited team member | 15 | Email unsubscribe or spam complaint | -5 | ||
| Country | United States | 10 | 10 | Job Role | Sales | 15 | 15 | Visit on pricing page | 10 | Company discount period ended | -10 | ||
| Number of Employees | 11-50 employees | 15 | 8 | Role in Buying Process | Influencer | 20 | 15 | Created entry | 4 | 10 | |||
| Revenue | $1M-$10M | 15 | 10 | Tech Stack | Proficient (major technologies) | 10 | 8 | Website visits | 15 | 5 |
Download the full lead scoring template to see the whole example with the total score and normalized score formula and create your own lead scoring framework:
Lead Scoring with UserMotion: A One-Time Setup
Setting up a lead scoring system involves many steps. You need to pay attention to every piece of data, criteria, and formula to make sure you get the scoring right and focus on the correct leads.
As your business and products grow and change, so will your data and criteria. This means you might have to set up your lead scoring system all over again to keep it accurate.
But with tools like UserMotion, you don’t need to worry about complex Excel sheets, templates, or spending a lot of time and effort on technical setup.

UserMotion scores your leads with a self-learning predictive scoring algorithms that constantly improves from user behavior.

With UserMotion, you can effortlessly identify and prioritize leads and have a clear view of top high-potential accounts, lead loosing interest or other custom revenue opportunity lists.

Its intelligent system not only organizes your leads in a clear, prioritized list to make it easier for you to focus, but also segments various revenue opportunities or indicators of early churn. This audience segmentation is presented in a single, easily sortable list, allowing you to quickly navigate through leads based on their alignment with your customer profile and their buying intent.

Unlike manual lead scoring templates that demand technical know-how for implementation with CRM or other sales tools, like Intercom, HubSpot, Close or Stripe, UserMotion offers a user-friendly approach that doesn’t require extensive technical expertise. This ease of integration ensures that you can focus more on strategy and less on the complexities of system setup.
Conclusion: Make Lead Scoring a Key Part of Your Strategy
By using a template or a tool, lead scoring should be a regular part of your workflow, especially in sales and marketing strategies.
Using a manual created lead scoring framework is good, but it is not sustainable and the most effective way. But, lead scoring tools like UserMotion consistently improve, adopt the changes and support you with real-time alerts, integrations, and automations.
Start creating with our template or start scoring right now with UserMotion.


